A Closer look at the data
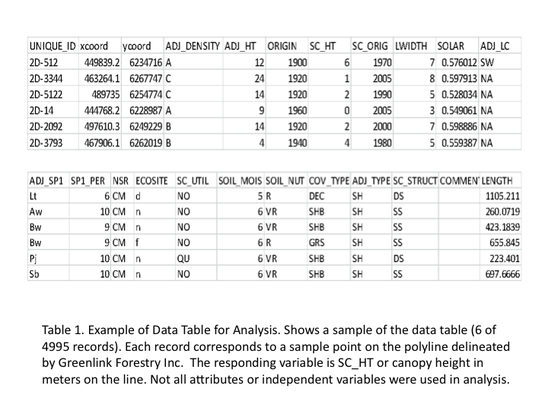
Description of Attributes:
UNIQUE_ID= ID of the sample point
x and y coord= location in the province
ADJ_DENSITY= average crown closure of adjacent canopy (%). A=6-30%, B=31-50%, C=51-70%, D=71-100%
ADJ_HT= adjacent canopy height (m)
ORIGIN= origin (year) of adjacent forest based on fire, forestry and industry disturbance history
SC_HT= canopy height online (m)
SC_ORIG= origin of vegetation online based on year of clearing
LWIDTH= width of seismic line (m)
SOLAR= potential direct incident radiation with heat load index
ADJ_LC= leading conifer species in adjacent stand (i.e. Lt=larch, Aw=Aspen, Bw=Paper birch, Pj=jack pine, Sb=black spruce, Sw=white spruce)
ADJ_SP1= dominant tree species in adjacent stand
SP1_PER=percent cover of dominant species
NSR=Natural subregion. Either CM (Central Mixedwood) or LBH (Lower Boreal Highlands)
ECOSITE=ecosite classified by the Canadian Forest Service corresponding to the NSR
SC_UTIL=utilization of line indicated by presence of trails. None, Quad/ATV, game trails and truck trails/tracks
SOIL_MOIS=soil moisture regime classification that sample point is within. Determines the availability of moisture to vegetation. Ranges from subxeric (3) to hydric (9).
SOIL_NUT=soil nutrient regime classification that sample point is within. Determines the availability of soil nutrients to vegetation. Ranges from poor to very rich.
COV_TYPE=the type of cover class at the polyline. I.E. shrub, coniferous, grass, deciduous, bare ground.
ADJ_TYPE=Type of cover class at location where ecosite call made
SC_STRUCT=the stand structure. Single layer, double layer or complex.
COMMENT= additional comments about whether the line leads to a well site and has winter access.
LENGTH=length (m) of the polyline that the sample point is within.
EXPLORATORY GRAPHICS
|
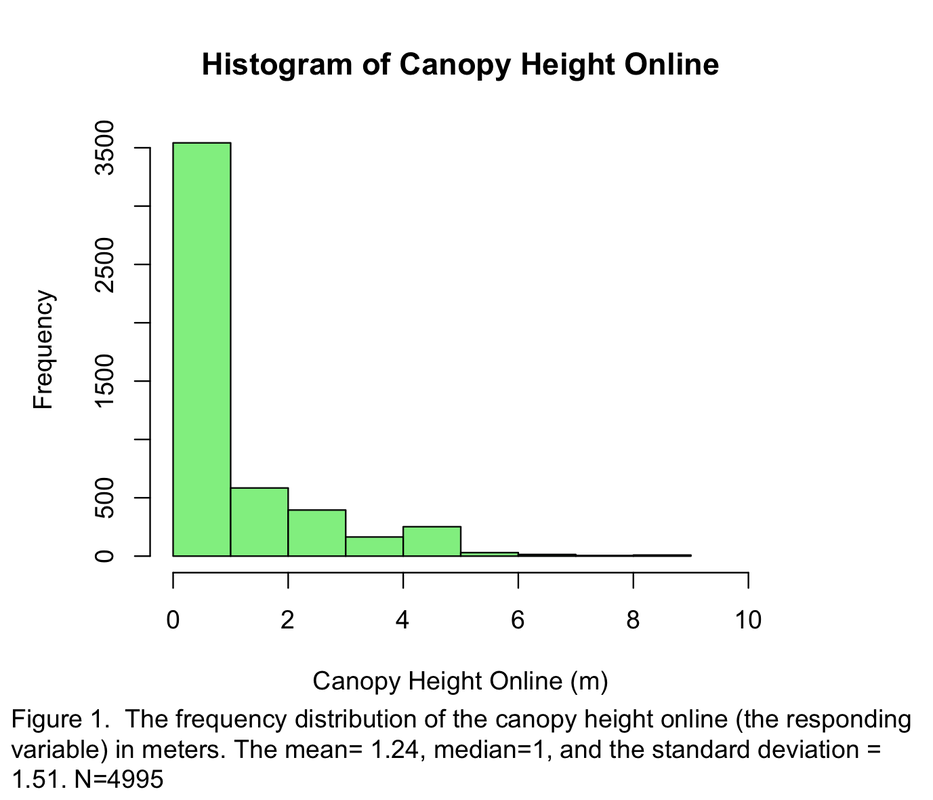
Below are displayed a number of graphics that reveal potential relationships between the amount of vegetation recovery (canopy height online) and spatially related site and stand characteristics. When observing these graphs, trends will be highlighted that appear to have effects on recovery (canopy height online).
To the right, first observe the distribution of the responding variable-canopy height online (Fig. 1). This is far from a normal distribution and the large frequencies of 0 m values is responsible for this abnormality. The most recovery, or greatest canopy height online, sampled is 9 m and appears to include only one observation. From this information, we can deduce that recovery of seismic lines is a very slow process and /or little to no recovery is occurring. It will be necessary to use non-parametric statistical methods because transformations could fix the high number of zero values and normalize the data. COULD LINE WIDTH BE LIMITING RECOVERY? |
|
|
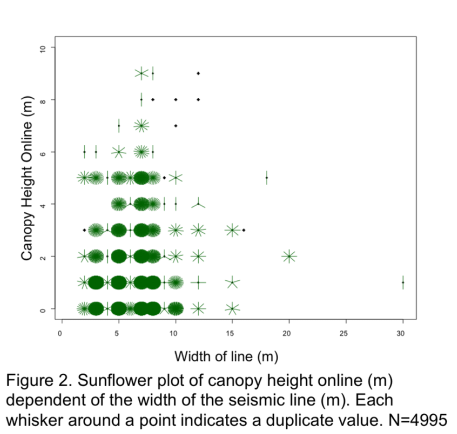
Other studies have shown that limiting the width of the seismic line may reduce impacts on boreal fauna such as the ovenbird and marten (Bayne et al. 2012). It is difficult to observe a clear trend here because we have a far greater number of seismic lines between 3-8 m than 9-30 m (Fig. 2). From the sunflower plot, there may be a slight trend for decreased canopy height online with increasing line width but this needs to be further analyzed. Alternatively, there may be an interesting pattern where growth increases once the line width is 5 m and increases until 10 m, in which it shows a decreasing trend. A possible explanation for this trend could be that a very narrow seismic line <5 m may reduce the amount of available light because of shading of the adjacent canopy.
IF not width, what other factors might limit recovery?
|
Increased Time=increased REcovery...Right?
It makes sense that if a seismic line was cleared further back in history, it has more time to recover and canopy height on the line should be greater. Generally, the bar plot below seems to suggest this, at least for 1970-1990 (Fig. 3a). The relationship becomes more complicated in the last ten years with recovery of the canopy less than 2 m and high variability in the most recent years. Figure 3b is the reciprocal line graph to 3a, showing instead the number of years since the original disturbance that the canopy has had time to grow. Recovery may increase with time, but it may need greater than 15 years to recover.

|

|
Age isn't everything
Characterizing the standAnalyzing the stand vegetation adjacent to the seismic line may provide clues as to why recovery is or is not occurring.
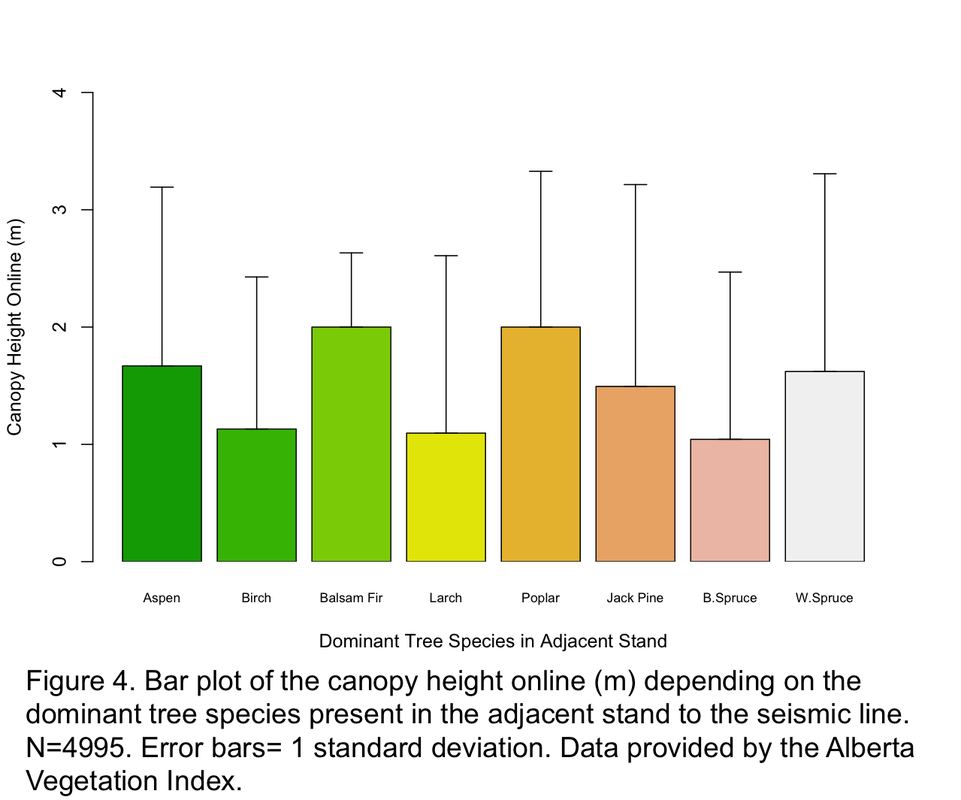
The bar plot to the right reveals that there is more growth in seismic lines adjacent to stands that contain Aspen, Balsam Fir, Balsam Poplar, Jack Pine and White Spruce as their dominant tree species (Fig. 4). Canopy heights online are lower for Paper Birch, Larch and Black Spruce stands. 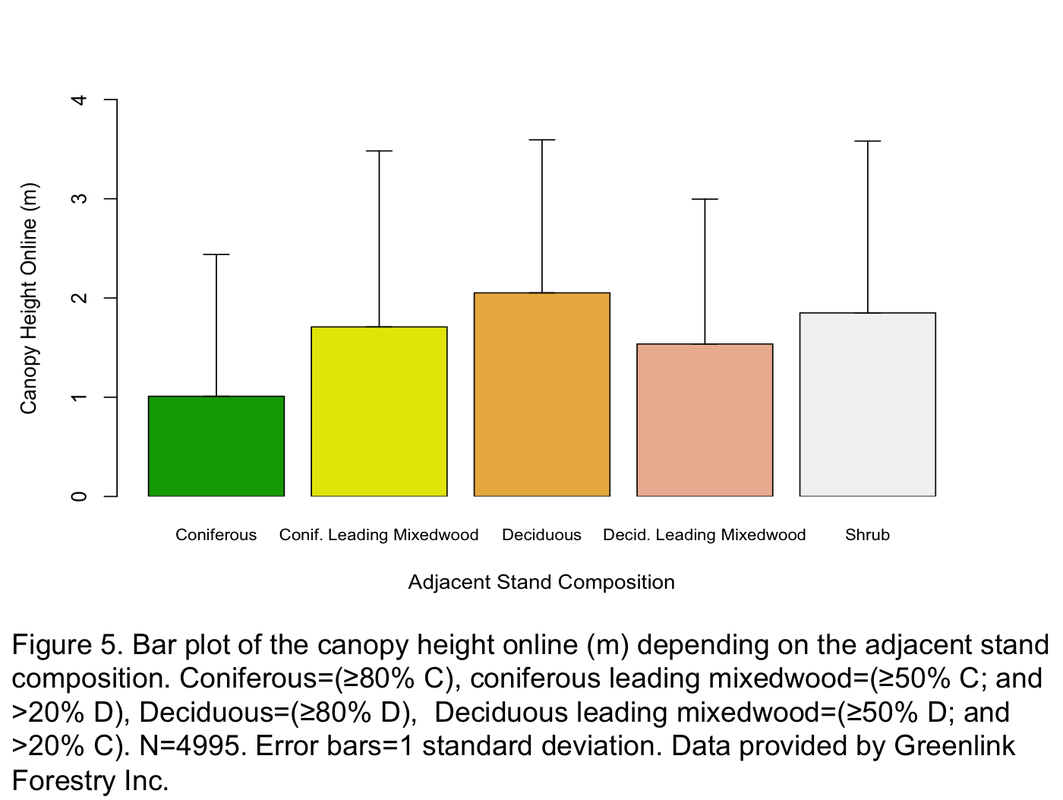
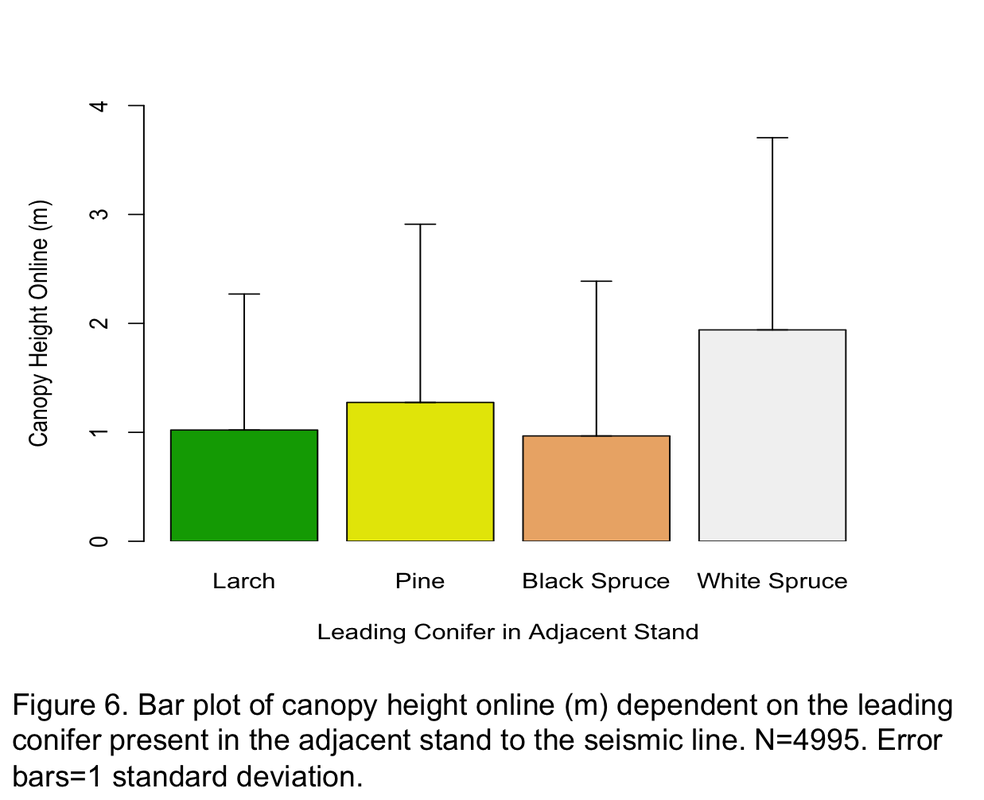
If we look more closely at conifer containing stands, we observe that if the leading conifer is black spruce or larch the seismic line shows the lowest average canopy height online (Fig. 6.) If the leading conifer is white spruce, there is the greatest average canopy height online.

|
If we examine the bar plot to the left (Fig. 5), we can compare the composition of the adjacent stand to the seismic line. We can see that coniferous stands show the lowest average canopy height online.
The line graph to the left shows the average crown closure of the stand adjacent to the sample point on the seismic line. If the crown closure is 71 to 100 %, average canopy height online is slightly higher (Fig.7). This is a very weak difference and ultimately it is likely that crown closure of the adjacent stand has little importance for recovery on the seismic line.
In summary, there are observable and likely related trends visible in the data concerning the vegetation in the adjacent stand. It may be possible that inherent features of these attributes have a direct effect on canopy height online. There is also a possibility that underlying environmental factors and gradients are responsible for both the vegetation on the surrounding stand and on the seismic line. We can suspect that there are interactions between adjacent vegetation and other environmental factors that can lead to arrested forest succession (no recovery). |
Digging Deeper: Ecosite and soil
The study site contains two natural subregions: Central Boreal Mixedwood and Lower Boreal Highlands. Each of these natural subregions is divided into ecosites classified by having similar vegetation, soil characteristics and moisture. Detailed descriptions of these ecosites is available in The Field Guide to Ecosite in Northern Alberta by Natural Resources Canada and The Canadian Forest Service.
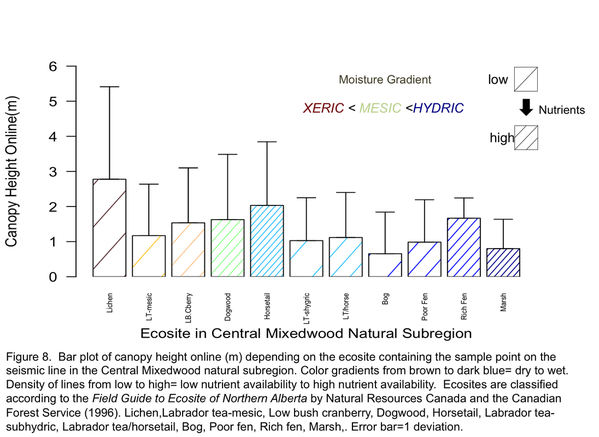
The lowest canopy height online is in the "bog" ecosite . This region is wet and has a poor nutrient regime. Growth is higher in the "lichen" ecosite. This is somewhat surprising because this ecosite is typically very poor in nutrient availability, but it is very dry. Overall, there is variability between different ecosites in the Central Boreal Mixedwood. Despite the marsh having high nutrient availability, the higher moisture content of the soils likely restricts growth.
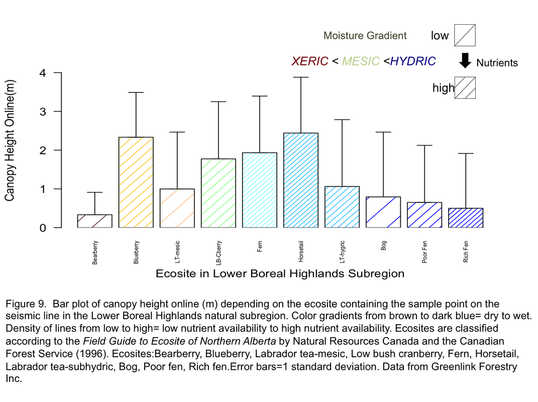
The lower boreal highlands comprises a smaller region of the study site than the central mixedwood. Ecosites with high moisture have lower growth, with the exception of the bearberry ecosite which has low moisture and poor nutrient availability. This exception differs from trends in the central mixedwood. There is increased canopy height online in the blueberry, low-bush cranberry, fern and horsetail ecosites, which all have medium to rich nutrient availability. Again, we see that there is variability across ecosites.
What are the two driving factors of ecosite variability? Moisture and nutrient availability. Below, we take a closer look at these two factors.
What are the two driving factors of ecosite variability? Moisture and nutrient availability. Below, we take a closer look at these two factors.
Getting to the root of it all.
moisture
The line graph above looks at the moisture regime present in the ecosite (Figure 10). Generally, there appears to be a trend that shows decreasing canopy height online as the amount of moisture available increases. From subxeric to subhygric, the mean canopy heights are similar, but as you move into higher moisture regimes recovery seems to be limited.
|
nutrients
The soil nutrient regime is likely a very important factor for recovery. The line graph above shows that canopy height is highest in rich soils, and there is a trend for increasing canopy height with increasing nutrients (Figure 11). Possibly, there is another factor or factors involved at rich nutrient sites that limits recovery.
|
Moving down the line
Another factor that was recorded was line utilization. Repeated use of the line creates continual disturbances for the vegetation growing there. The figure below shows the canopy height online according to the type of use observed on the line: game trails, no use, quads (ATV's) and trucks (Figure 12).
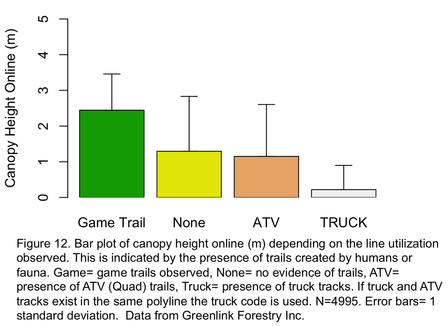
The large differences seen in utilization of the seismic lines suggest that this factor may be key to recovery. The prevalence of game trails on lines with greater mean canopy height may be due to a inverse relationship. It could be very possible that fauna are attracted to lines with increased vegetation growth. These lines may have increased food for foraging of ungulates like deer and moose. Additionally, a reduction in canopy height compared to the adjacent stand may allow seismic lines to be used as travelling corridors. Clearly, when vehicles as large as trucks are using seismic lines, arrested succession is likely.
What does this really tell us and what next?
Exploring the data has shown us a number of possible relationships that may be significant between canopy height online and other factors. Only variables that seemed to show potential relationships were displayed and some graphs were excluded. If we are to really discover the factors most responsible for recovery on linear corridors we need to go further. It is necessary to investigate relationships and interactions between these factors and decipher which are most important in determining recovery. To achieve the objectives of this project, I will perform a Regression Tree Analysis to delve deeper into this important issue of increasing linear disturbance in the boreal forest of Alberta.
