Methods:
STUDY SITE:
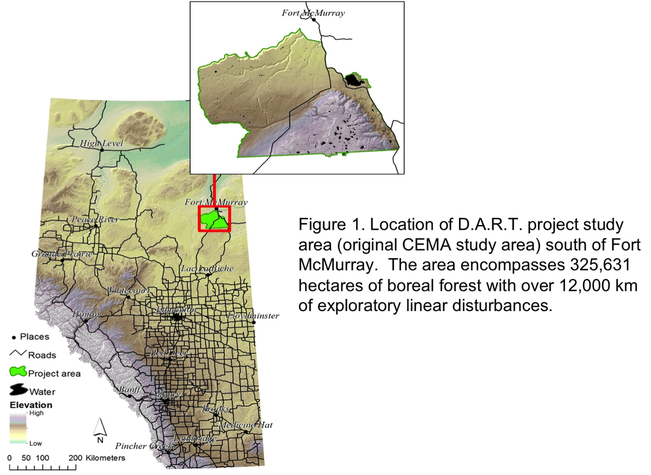
A study site was selected south of Fort McMurray and represents the Cumulative Environmental Management Association (CEMA) study boundary in the Regional Municipality of Wood Buffalo, Alberta. This area covers a total of 325,631 hectares, or the equivalent of 33 total townships (Figure 1). Approximately 69% of the study site is located in the Central Mixedwood Natural
Subregion, while 31% is located in the Lower Boreal Highlands Natural Subregion (ASRD, 2005).
Subregion, while 31% is located in the Lower Boreal Highlands Natural Subregion (ASRD, 2005).
Lineal inventory:
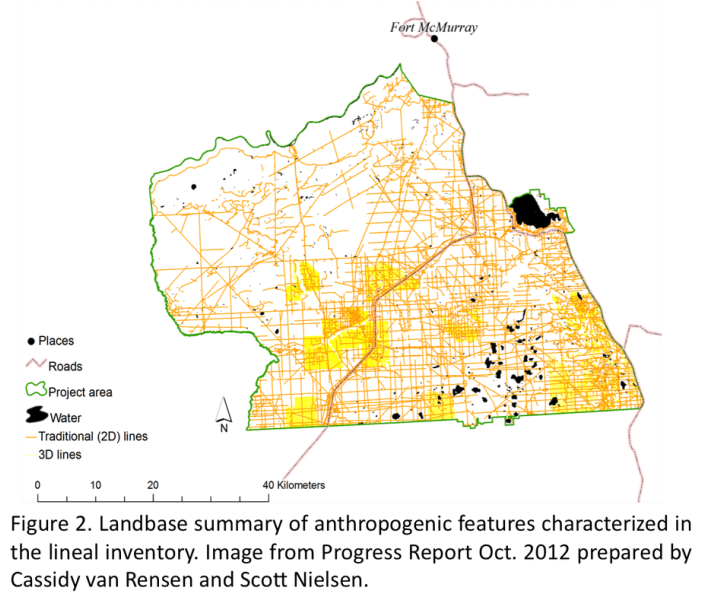
GreenLink Forestry recently completed a lineal characterization of the study site using remotely sensed data (Nash, 2012). This includes mapping of all anthropogenic disturbances up to 2008 and 2009. A total of 12,313 km of anthropogenic features were surveyed on 33 townships. 62% were low-impact 3D seismic lines characteristic of the oil sands regions, while 30% represented 2D seismic lines with wider footprints. The remaining 8% of linear disturbances consisted of cut-trails and pipelines. Linear disturbances were digitized into polylines (shapefiles) to create a lineal seismic inventory. For each polyline, attributes were recorded and include line type (anthropogenic feature), line width, natural subregion, mineral expression, organic expression, soil moisture, soil nutrients, ecosite, utilization, utilization length, first disturbance origin, last disturbance origin, biotic and abiotic structure, % cover class, distribution class, distribution type, canopy height, adjacent stand type, and leading conifer of adjacent stand type. For my project, I used only 2D seismic lines and included attributes that were well documented and complete (i.e. without many "NA's"). This included the attributes: line width, natural subregion and ecosite, soil moisture, soil nutrients, utilization, most recent disturbance (i.e. clearing of seismic line), canopy height online, adjacent stand type, and leading conifer of adjacent stand type.
AVI
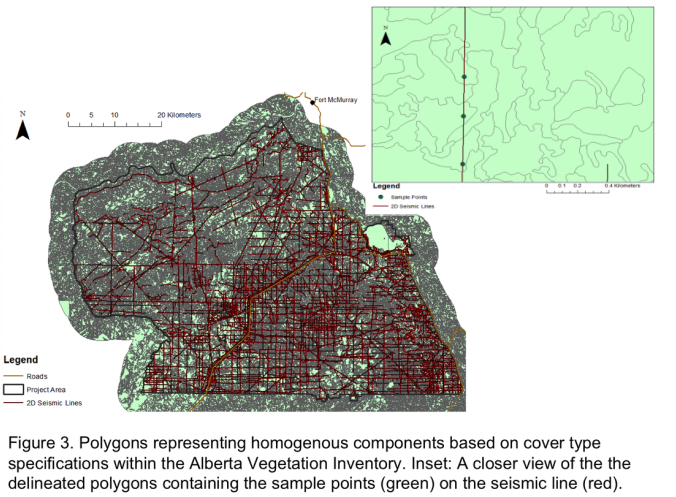
I used Alberta Vegetation Index (AVI) data for my study site to provide the attributes of the stand adjacent to the seismic line: stand origin, dominant tree species and crown closure.
LIDAR- BUILDING A DIGITAL ELEVATION MODEL
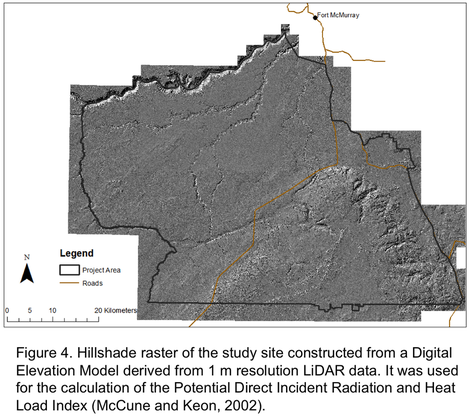
LiDAR is a type of areal remote sensing using a laser and can provide data on both the bare earth and vertical structures on the landscape. Using Light Detection and Ranging (LiDAR) data supplied from Sustainable Resource Development (SRD), I constructed a digital elevation model (DEM) of the study site at 1 m resolution from the last return data (bare earth). From the DEM, I calculated slope and aspect of the study site. This allowed me to calculate the potential direct incident radiation using an equation from McCune & Keon (2002). See more at http://people.oregonstate.edu/~mccuneb/radiation.htm.
I converted PDIR to a Heat Load Index which corrected radiation values to factor in the increased heat in the afternoon on south west facing slopes.
I used the LiDAR first return data to give me an estimate of canopy height on the seismic line. I constructed a Digital Surface Model (DSM) of the first return data (highest elevation points in the point cloud) using LAS tools on ArcGIS 10.1. I could calculate canopy height across the landscape by subtracting the DEM from the DSM. These values are my responding or dependent variable in the study. (* LiDAR first return data not yet available, canopy heights online estimated from data provided by Greenlink Forestry).
Sampling the landscape
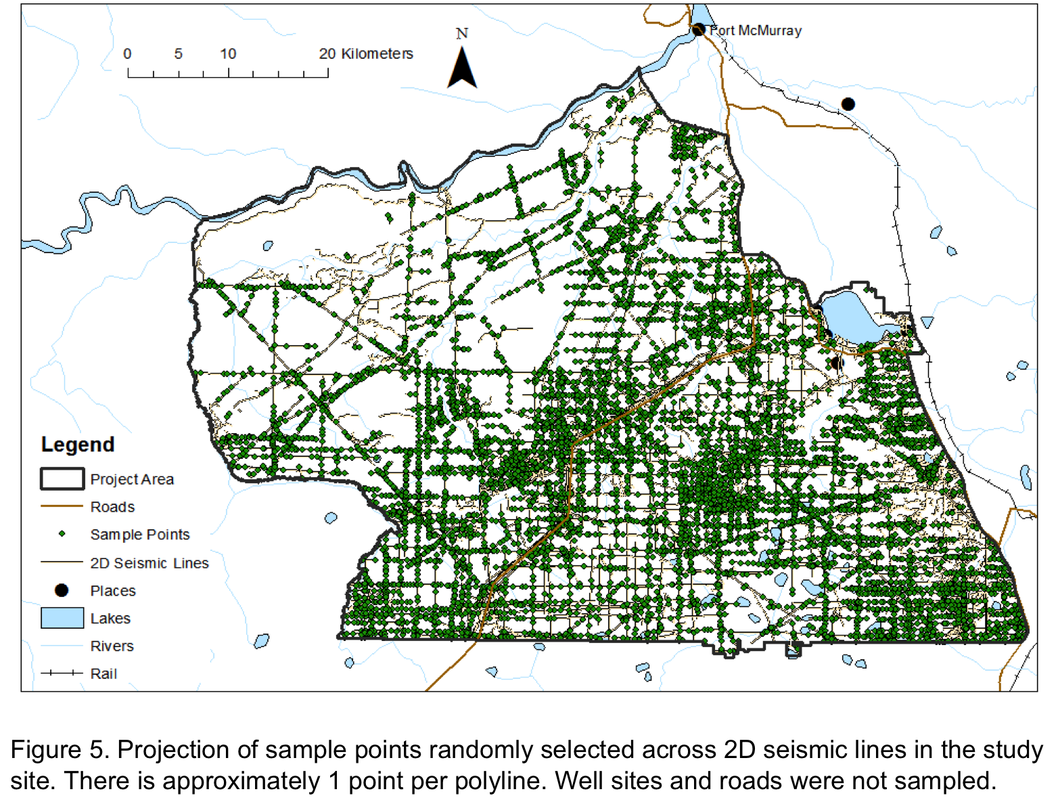
To create a randomized sample of plots over the landscape, I used a tool in ArcGIS 10.1 to randomly select a point on each polyline delineated by Greenlink Forestry. This amounted to over 6000 sample points. I only selected points which included all relevant information on desired attributes. After this filtering, I have a total of 4995 sample points randomized across the landscape. For each point, I have spatial data on multiple stand and landscape variables (SEE DATA)
Projected statistical analysis
After exploring the data, I will conduct a regression tree analysis that includes all terrain, stand and site history variables. I will use the package "rpart" in the free software R version 2.12.This will reveal relationships between different factors and how they affect canopy height online.
